
Compare the Ten Largest Countries With Water Excluded
Compare the top 10 countries by land area using World Bank figures, see why Canada ranks fourth, and build a sourced ranking ready for a public data page.

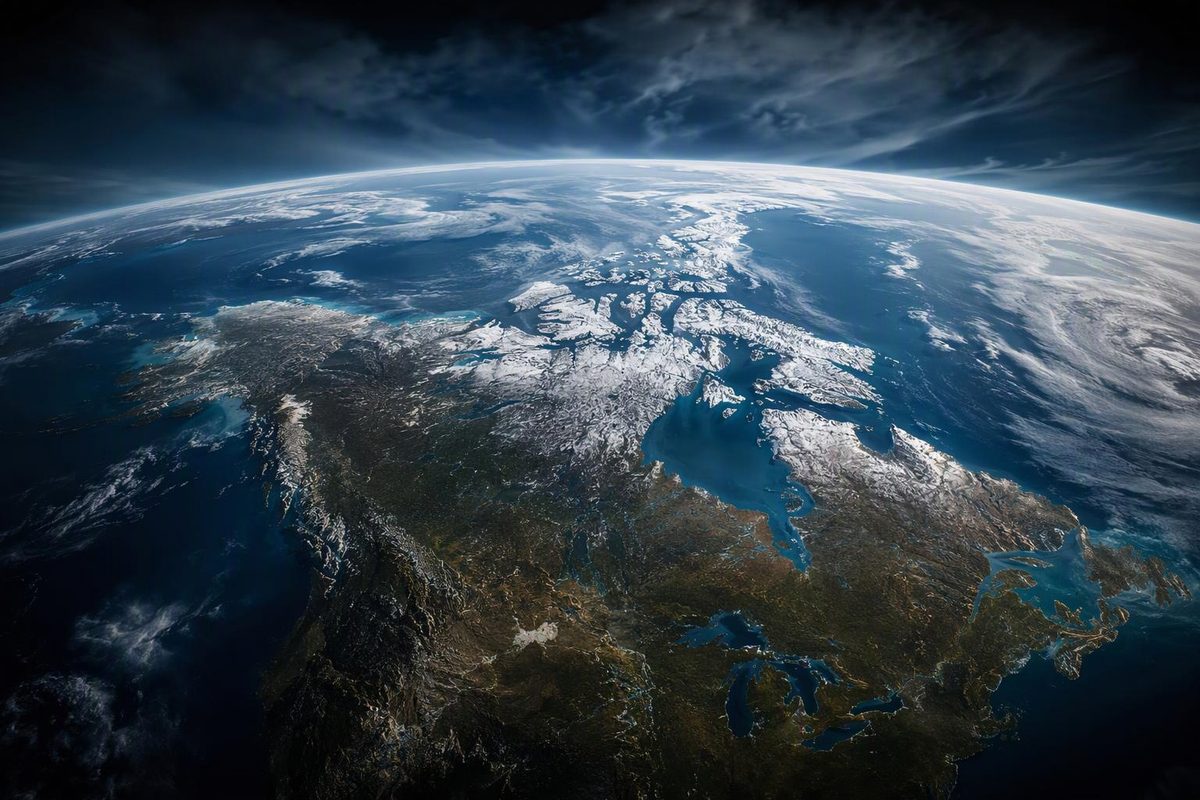
Russia is the biggest country by land area, followed by China, the United States, Canada and Brazil. In the World Bank’s 2023 observations, Russia has 16,376,870 km² of land. This ranking excludes inland water; Canada’s familiar second-place ranking uses total area instead. For a table of the “biggest countries by land mass,” the precise column label is land area, not total area or surface area.
Choose two countries to compare their land areas and see the difference.
Compare Land Area
Russia Has More Land
6,988,660 km² more
Russia: 16,376,870 km²
China: 9,388,210 km²
First ÷ second: ~1.74×
Difference uses exact reported areas; ratio is rounded.
| Rank | Country | Land Area (km²) |
|---|---|---|
| 1 | Russia | 16,376,870 |
| 2 | China | 9,388,210 |
| 3 | United States | 9,147,420 |
| 4 | Canada | 8,788,700 |
| 5 | Brazil | 8,358,140 |
| 6 | Australia | 7,692,020 |
| 7 | India | 2,973,190 |
| 8 | Argentina | 2,736,690 |
| 9 | Kazakhstan | 2,699,700 |
| 10 | Algeria | 2,381,740 |
Source: World Bank / FAO, AG.LND.TOTL.K2, 2023 observations; retrieved October 4, 2026.
Definition and Comparison Method
Land area excludes inland water, national claims to continental shelf and exclusive economic zones. Countries only; no regional aggregates or dependencies. Russia is displayed as a shortened name for Russian Federation.
Difference = larger area minus smaller area. Ratio = first country's area divided by second country's area. Selecting the same country gives a zero difference and a 1.00× ratio.
These are reported statistical values, not precise boundary measurements. Revisions can reflect updated data rather than physical changes.
The Top 10 Countries by Land Area
These are 2023 observations, not estimates of country size in 2026. They use the World Bank’s Land area (sq. km) indicator, sourced from the UN Food and Agriculture Organization. The World Bank data response reports a dataset update date of July 13, 2026; the figures were retrieved October 4, 2026.
| Rank | Country | Land Area (km²) |
|---|---|---|
| 1 | Russia | 16,376,870 |
| 2 | China | 9,388,210 |
| 3 | United States | 9,147,420 |
| 4 | Canada | 8,788,700 |
| 5 | Brazil | 8,358,140 |
| 6 | Australia | 7,692,020 |
| 7 | India | 2,973,190 |
| 8 | Argentina | 2,736,690 |
| 9 | Kazakhstan | 2,699,700 |
| 10 | Algeria | 2,381,740 |
The table ranks countries, not continents, dependencies or regional aggregates. Russia’s source name, “Russian Federation,” is shortened for display. All values use the same indicator and observation year from the World Bank country series.
The observation year matters when copying these numbers. A dataset refreshed in 2026 can still contain observations labeled 2023. Calling the table “2026 land area” would confuse the publication or retrieval date with the year attached to the values. Keep those dates separate in any downloadable file or public source note.
The figures are presented as reported, rather than rounded to millions of square kilometres. That makes the table suitable for both reading and reuse: a reader can see the ranking, while a spreadsheet can calculate differences without first reconstructing rounded values.
Canada Ranks Fourth When Inland Water Is Excluded
Land area and total area are different columns, not interchangeable labels. The choice of measure explains why a familiar country ranking may differ from this one.
The World Bank’s land-area definition excludes inland water bodies, national claims to continental shelf and exclusive economic zones. Inland water generally includes major rivers and lakes. This is the definition used for every number in the table above.
The World Bank’s broader surface area measure includes inland bodies of water and some coastal waterways, according to its surface-area definition. It therefore answers a different question, even though both indicators use square kilometres.
Canada’s familiar second-place ranking refers to total area. Statistics Canada’s archived 2011 comparison explicitly includes freshwater in that total. In the land-only World Bank series used here, Canada ranks fourth, below China and the United States.
That archived comparison establishes the distinction between the measures; it is not a replacement value for this 2023 table. Mixing a Canadian total-area figure from that reference with the other countries’ land-only figures would create a ranking with inconsistent denominators.
This article does not supply a complete, same-year surface-area dataset, so it does not offer a total-area toggle or an alternative total-area top 10. A defensible comparison needs the actual values for the chosen measure, not just a rearrangement of the country names.
The Largest Gaps Are Visible in the Numbers
The comparison tool subtracts the smaller land-area value from the larger one. Its ratio divides the first selected country’s land area by the second’s. These are calculations from the reported figures, not additional World Bank observations. Ratios are rounded for display; the underlying areas and differences remain unrounded.
Russia Has 6,988,660 km² More Land Than China
Russia’s lead over the second-ranked country is 6,988,660 km²: 16,376,870 minus 9,388,210. Its land area is approximately 1.74 times China’s using these observations.
Those two outputs answer different comparison questions. The difference expresses the gap in square kilometres. The ratio expresses relative size. Neither changes the ranking, and neither should be described as a separate estimate of Russia’s area.
China, the United States and Canada Are Closer Together
China exceeds the United States by 240,790 km² in this series. The United States exceeds Canada by 358,720 km². These gaps are much smaller than Russia’s lead over China, although all four countries occupy distinct positions in the table.
For publication, preserve the exact figures when comparing these rows. Rounding country areas before sorting or calculating gaps can obscure the distinctions readers are trying to check. Display formatting should not change the stored values.
Australia and India Have a Large Gap Between Adjacent Ranks
Brazil exceeds Australia by 666,120 km². Australia, in turn, exceeds India by 4,718,830 km². A ranking alone gives both pairs adjacent positions, but their differences are very different.
A rank is an ordering, not a measure of distance. This is why an exact-value table or a properly scaled chart is more informative than a numbered list of country names. Readers can distinguish a close pair from a wide gap without assuming that each step down the ranking represents the same amount of land.
Argentina and Kazakhstan Differ by 36,990 km²
Argentina’s reported land area is 2,736,690 km², compared with Kazakhstan’s 2,699,700 km². Their difference is 36,990 km². Kazakhstan exceeds Algeria by 317,960 km².
These calculations describe the published snapshot. They do not establish the precision of boundary measurements or prove that the difference between two future releases would represent a physical territorial change.
Treat the Values as a Sourced Statistical Snapshot
The World Bank’s land-area methodology notes warn that complete consistency across countries and time is not possible. Revisions can reflect updated data rather than physical changes in area. Preserve the source’s reported figures instead of treating them as precise boundary measurements.
Using one indicator and one observation year gives this table a consistent basis for comparison. It does not eliminate every difference in how national data were assembled. The appropriate claim is that these are the reported land-area values in the selected series, not that all country boundaries were measured identically.
Keep the distinction between source values and editorial presentation visible. “Russia” is a display label for “Russian Federation”; adding thousands separators is formatting; subtracting two areas creates a derived comparison. None of those edits should overwrite the original numeric value or its source identity.
If a later download changes a value, compare it with the retained source file before editing the public table. A revised observation, a different year and an accidental spreadsheet change are three different explanations. Recording provenance makes it possible to tell them apart.
Structure the Spreadsheet Around One Comparable Measure
Use one country per row and one land-area field. A compact publication file needs the following columns:
| Column | Stored Content |
|---|---|
rank_land_area |
Numeric rank; 1 is largest |
country_name |
Readable display name |
country_code |
Source identifier, such as RUS or CAN |
land_area_km2 |
Numeric land-area value |
data_year |
2023 for this snapshot |
Store Russia’s land area as 16376870, not 16,376,870 km². Keep the thousands separators and unit symbol in the displayed table or heading. Otherwise, the area field may be interpreted as text, making numeric sorting and calculations unreliable.
The unit belongs in the column name and accompanying documentation. A plain field named area leaves readers unable to tell whether it contains land area, surface area or another measure. land_area_km2 preserves both the definition and the unit when someone downloads the file separately from the article.
Keep the source’s country identifier alongside the display name. That lets a reader connect the shortened “Russia” label to the RUS record without relying on a text match. The display name can be readable while the identifier remains stable within this source.
Do not insert explanatory rows, regional totals or source notes among the country records. Put table-level provenance beside the dataset so that sorting the rows cannot detach a country from its area or bring a note into the ranking.
Sort the Whole Dataset Before Assigning Ranks
Sort by land_area_km2 from largest to smallest, moving complete rows together. Then assign rank_land_area. Sorting only the area column would pair country names with the wrong numbers while leaving a superficially plausible descending list.
Check the result against the published snapshot: Russia should be first at 16,376,870 km², and Algeria should be tenth at 2,381,740 km². Canada should be fourth, not second. These checks target the errors most likely to arise from a wrong measure, a text sort or a broken row association.
If you expand beyond the top 10, exclude regional totals and dependencies before ranking. A regional aggregate is not another country, and its inclusion would change the meaning of the table. Record the country-selection rule rather than leaving readers to infer it from the visible names.
Leave missing values blank instead of converting them to zero, and do not assign those rows a rank. Zero would assert an area value that the source has not supplied. A blank indicates that the comparison cannot be completed for that row using the selected data.
Publish the Source Note With the Table
Record the indicator code AG.LND.TOTL.K2, source link, observation year, retrieval date and country-selection rule alongside the published table. Keep a copy of the source download so later revisions are distinguishable from your edits. The public ranking disclosure checklist covers the other decisions readers need to see.
The source note should explicitly say that inland water is excluded. Readers arriving at the table without the surrounding article should still be able to understand why Canada ranks fourth. A bare “Source: World Bank” label does not identify the measure or the year.
TablePage supports CSV, TSV, XLSX and XLS uploads and generates a public dataset page with a shareable link and filterable table. After uploading, confirm that all 10 rows, numeric values and source notes are available to readers. Check that the area column sorts numerically and that a filter does not silently redefine the displayed ranks.
For a comparison chart, use a descending horizontal bar chart with an axis starting at zero and labeled Land area (km²). Keep the exact-value table beside it. The chart communicates relative size; the table supplies the figures readers can reuse. Both should describe the same land-only, 2023 snapshot.