
Russia Leads the World’s Largest Countries by Surface Area
Compare Russia with the ten largest countries using UN surface-area figures, see what the measurements include, and build a clearly sourced country ranking.

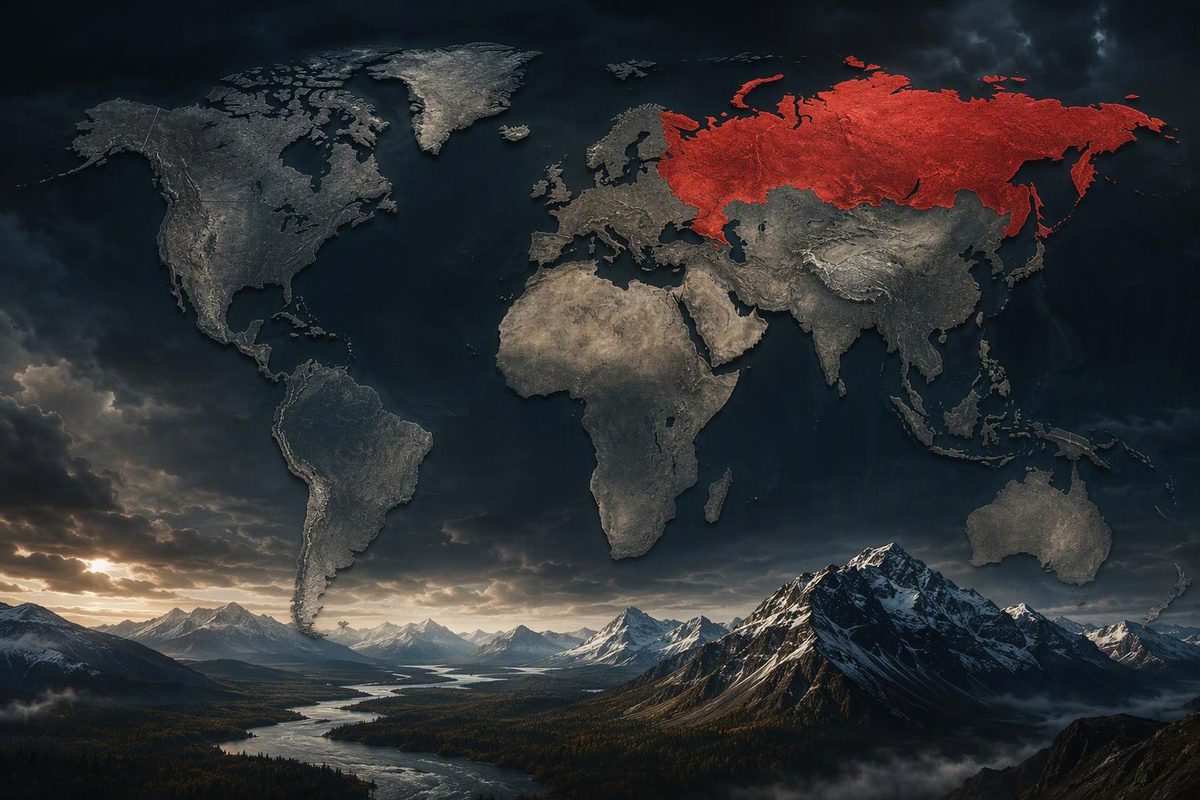
Russia is the biggest country in the world by area, with a reported surface area of 17,098,246 km², or about 17.1 million square kilometres. Canada is second at 9,984,670 km². Russia is roughly 71% larger than Canada, calculated from those figures in the UN Demographic Yearbook 2024 area table. Here, “biggest” means reported surface area, not population or land area alone.
Choose a country to compare its reported surface area with Russia’s.
Compare Surface Areas With Russia
Reported surface area: land plus inland waters, subject to UN coverage notes.
Russia Compared With Canada
1.71× the surface area
Russia is approximately 71.2% larger.
Difference: 7,113,576 km²
Canada: 9,984,670 km²
Russia: 17,098,246 km²
View All Ten Source Values
| Rank | Country | Area (km²) |
|---|---|---|
| 1 | Russia | 17,098,246 |
| 2 | Canada | 9,984,670 |
| 3 | United States | 9,833,517 |
| 4 | China | 9,600,000 |
| 5 | Brazil | 8,510,417 |
| 6 | Australia | 7,692,024 |
| 7 | India | 3,287,263 |
| 8 | Argentina | 2,796,427 |
| 9 | Kazakhstan | 2,724,910 |
| 10 | Algeria | 2,381,741 |
Ranks are calculated from reported country values; dependencies and separately reported territories are excluded. Argentina’s value excludes its Antarctic area.
Source: UN Demographic Yearbook 2024, Table 3 and methodological notes; ratios and differences calculated from the displayed values.
The Ten Largest Countries by Reported Surface Area
This ranking uses the 2024 surface-area column from one UN source, sorted from largest to smallest. The values are preserved as published, rather than assembled from country lists with potentially different definitions.
| Rank | Country | Reported Surface Area (km²) |
|---|---|---|
| 1 | Russia | 17,098,246 |
| 2 | Canada | 9,984,670 |
| 3 | United States | 9,833,517 |
| 4 | China | 9,600,000 |
| 5 | Brazil | 8,510,417 |
| 6 | Australia | 7,692,024 |
| 7 | India | 3,287,263 |
| 8 | Argentina | 2,796,427 |
| 9 | Kazakhstan | 2,724,910 |
| 10 | Algeria | 2,381,741 |
Source: UN Demographic Yearbook 2024, Table 3. The ranks are calculated by sorting the reported country values; they are not a separate UN ranking.
Dependencies and separately reported territories are not ranked as countries here. Countries without a reported area value are excluded, not assigned zero. These inclusion rules matter when recreating the ranking: sorting every entry in a source table is not necessarily the same as sorting countries only.
The table also preserves the distinction between a source value and a display name. “Russia” is the reader-facing name used here; when preparing a downloadable dataset, document a change from the source’s “Russian Federation” rather than making the naming decision invisible.
Russia’s Lead Is a Comparison of Areas, Not Ranks
Russia and Canada occupy adjacent positions in the ranking, but their areas are not close. The roughly 71% difference describes Russia’s additional surface area relative to Canada’s surface area. It does not mean that Canada is 71% smaller than Russia: that would use Russia, rather than Canada, as the denominator.
The calculation is: percentage larger = (Russia’s reported surface area − the comparison country’s reported surface area) ÷ the comparison country’s reported surface area × 100.
The comparison tool applies that same calculation to each country in the top ten. Its area ratio answers a slightly different question: how many times the comparison country’s reported area fits into Russia’s reported area. Neither calculation changes the underlying UN figures.
A rank tells you order, not the size of a gap. The United States and China appear in third and fourth place under this source’s surface-area measure. Brazil and Australia follow them. Those positions should be read alongside the area column, rather than treated as equally spaced steps on a scale.
For a chart or shared table, retain the actual area values even if the headline focuses on rank. A reader should be able to distinguish “comes immediately after Russia” from “is nearly as large as Russia.” Canada illustrates why those statements are not interchangeable.
Surface Area Includes Land and Inland Waters
For this table, the UN defines surface area as land plus inland waters, assumed to include major rivers and lakes. Its general definition excludes polar regions and uninhabited islands, with exceptions noted. Those qualifications belong with the dataset, not just with an individual country’s description. See the Table 3 methodological notes.
“Reported surface area” is therefore a more accurate column label than “land area.” Relabelling these figures as land area would change what the table claims to measure without changing any of its values.
The distinction is particularly relevant when a reader encounters a different ordering elsewhere. Before deciding that one list is wrong, establish whether both lists measure the same thing. A land-only table and a surface-area table are not interchangeable, even when both use square kilometres.
Coverage notes can also qualify the apparent simplicity of a country total. Argentina’s reported area includes continental areas and islands but excludes its Antarctic area, according to Table 3, footnote 68. That is a qualification to Argentina’s value, not a rule to apply automatically to every other country.
The figures here should be understood as reported totals under this source’s definitions and notes. They do not, by themselves, provide a complete explanation of every boundary or territorial treatment. If a comparison depends on a particular territory, check the relevant coverage note rather than infer its inclusion from the size of the total.
Different Definitions Can Produce Different Country Lists
Using one source keeps this ranking internally consistent. It avoids a table in which one country’s value includes a category of water that another country’s value excludes simply because the figures came from different publishers.
The World Bank, for example, defines its surface-area indicator to include inland bodies of water and some coastal waterways. Its metadata also warns that year-to-year variations may reflect revised data rather than a physical change in area. See the World Bank surface-area indicator metadata.
That does not make the World Bank indicator unsuitable. It means its definition needs to travel with its values. A spreadsheet headed only area loses the information needed to judge whether two figures are comparable.
The United States Precedes China in This Dataset
The reported values used here are 9,833,517 km² for the United States and 9,600,000 km² for China. Sorting those figures in descending order places the United States above China.
This is a result for this UN surface-area dataset, not a claim that every land-area or total-area list must use the same ordering. If another ranking reverses the two, compare its measure, territorial coverage, source and reference year before copying a replacement value into this table.
Precision deserves the same care. Preserve China’s published value of 9,600,000 rather than adding digits from another source to make it look more exact. Displaying all values with the same separators makes a table easier to scan; it does not establish that every country’s measurement has identical precision.
Missing Values Do Not Mean Zero Area
A blank area field means the value is unavailable in the extract being used. Replacing it with zero creates a numerical claim the source did not make and can push that entry into a misleading position at the bottom of a complete ranking.
For this top-ten extract, entries without reported area values are excluded. For a larger public dataset, keep the missing-value status visible and explain whether those entries are omitted from ranking or displayed separately. The inclusion rule should remain the same when someone filters or downloads the table.
India Is the Population Answer, Not the Area Answer
If “biggest” means population, the answer changes to India. UN estimates placed India’s crossover with China in 2023, and UNFPA’s 2025 country page reports India’s estimated mid-year population at approximately 1.464 billion. Sources: UN population crossover and UNFPA India population.
Those population figures do not belong in the surface-area ranking as though they were another way to order the same column. India is seventh in the area table above, with 3,287,263 km². Its population position answers a different question.
If a shared spreadsheet contains both measures, label them separately and keep their years separate. The area table uses the 2024 column from the UN yearbook; the cited India population estimate is for mid-year 2025. A single unlabeled year column would obscure that difference.
A combined table can support both comparisons, but it needs distinct area and population ranks. Sorting by population should not overwrite a stored area rank or make an area-focused title describe the wrong ordering.
Keep the Source Definition in the Spreadsheet
To reproduce this ranking, give each country one row and store its reported surface area in a numeric column. Useful fields are country, surface_area_km2, area_year, source_url and coverage_note. These fields keep the value, unit, reference year and qualification connected when the table leaves the article.
Store Russia’s area as 17098246, not as the text string 17,098,246 km². Put the unit in the column header and use spreadsheet formatting to display thousands separators. That lets the same field support numerical sorting and the comparison calculation without first stripping punctuation or unit text.
Keep the published value separate from presentation choices. A compact view might display Russia as approximately 17.1 million km², but the underlying numeric cell should retain 17,098,246. Otherwise, calculations made from the downloaded table would use a rounded figure rather than the value shown in the source.
The coverage-note field is where a qualification such as Argentina’s Antarctic exclusion belongs. Do not insert the note into the area cell: that would turn a numeric field into mixed text and numbers. If a public view hides the note to save space, make it available in row details or alongside the download.
Sort Whole Rows and Preserve the Area Rank
Sort the complete dataset by surface_area_km2 in descending order. Sorting only the area column can detach values from their countries while leaving a table that still looks plausible.
Calculate rank after reviewing the numeric fields and applying the country-inclusion rule. If readers can later sort the public table alphabetically, retain an area_rank column so the original ranking remains visible. Row position after an alphabetical sort is not an area rank.
A reproducible caption also needs to identify the selection. “Largest countries” alone leaves the measure and source unstated. A suitable caption is: “Ten largest countries by reported surface area, UN Demographic Yearbook 2024; km²; descending order.”
Publish the Reviewed Extract With Its Qualifications
TablePage accepts CSV, TSV, XLSX and XLS files and generates a public dataset page with a filterable table and a shareable link. For this ranking, the reviewed extract should carry the area values, source reference and coverage notes—not just country names and positions. Upload only information intended for public access.
The default public view can be as compact as the three-column table above. Supporting fields can remain available for readers who need to inspect the reference year or a country-specific qualification. Keeping the main view short does not require removing those fields from the dataset.
Filtering also changes what readers see without changing the underlying global rank. A filtered result containing only selected countries should retain its original area_rank; it should not silently renumber the rows and imply a new worldwide ranking.
For a larger dataset, use the public ranking disclosure checklist to document inclusion rules, missing values and ties. Those disclosures let someone reproduce the result instead of relying on an unexplained order.
The central claim remains precise: Russia is the largest country by the reported surface-area measure used here. The source, units and inclusion rules are what allow that short answer to stand up as a shareable data table.