
North America’s Biggest Cities, With Comparable Population Data
Mexico City leads North America’s biggest cities under the UN’s 2025 definition. Use this population table and workflow to publish a clear comparison.

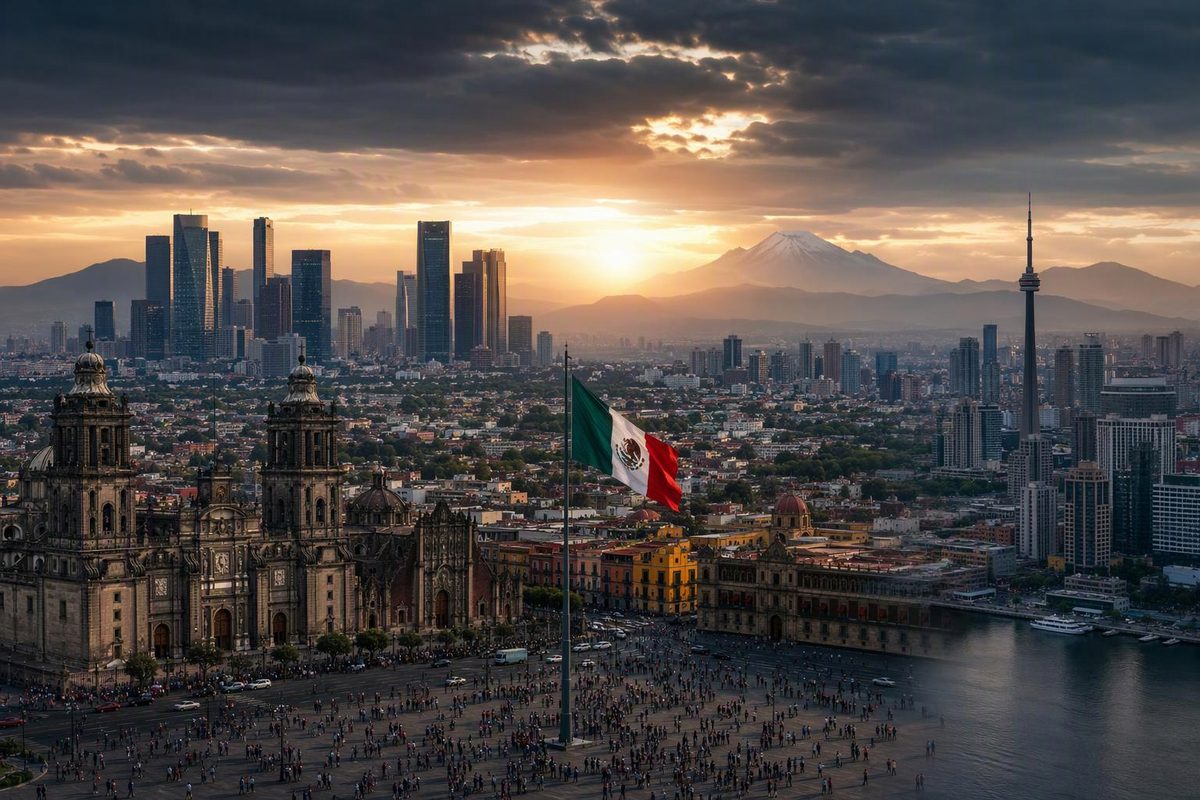
Mexico City is North America’s biggest city by population under the UN’s 2025 harmonized city definition, followed by New York City, Los Angeles and Toronto. These are the continent’s four cities with more than 5 million inhabitants in that dataset—not populations within municipal boundaries. Source: UN, The World’s Cities in 2025, annex table 3.
For a spreadsheet or public ranking, the definition matters as much as the number. Use the four-row extract below as a starting point, keeping one population series, one reference date and an explicit geographic scope.
The four largest cities under the UN’s 2025 definition
| North American rank | City | Country | Population, 1 July 2025 |
|---|---|---|---|
| 1 | Mexico City | Mexico | 17,734,000 |
| 2 | New York City | United States | 13,920,000 |
| 3 | Los Angeles | United States | 12,740,000 |
| 4 | Toronto | Canada | 5,494,000 |
Source and precision: The UN data booklet reports these estimates in thousands. The table converts them to people; the trailing zeros do not imply person-level precision. This is a 2025 reference table, not a live 2026 population count.
Here, North America includes Northern America, Central America and the Caribbean, following the UN M49 classification. Filtering only the UN’s “Northern America” group would exclude Mexico, which M49 places in Central America.
Choose what “city” means before combining rows
Three different datasets can answer three different questions:
| Geography | What you are comparing | Best fit |
|---|---|---|
| City proper | Population within the municipality or administrative boundary | Local government and services |
| Metropolitan region | The wider region associated with a city’s economy, labour and housing markets | Regional economic comparisons |
| Harmonized city | A consistently defined concentration of population | Cross-country population rankings |
The UN explains that municipal jurisdiction may suit governance questions, while a wider metropolitan region may better describe economic reach. Its 2025 comparison instead uses the Degree of Urbanization methodology: a city is a contiguous geographic area with at least 50,000 inhabitants and a density of at least 1,500 inhabitants per square kilometre. Source: World Urbanization Prospects 2025, chapter II.
Do not label the table above “metro populations” or merge it with city-proper counts. Similar city names do not establish equivalent boundaries.
Prepare a publishable spreadsheet
To reproduce this extract, take the 2025 population column from annex table 3 of the UN data booklet, retain cities in the three North American subregions and sort population descending.
The World Urbanization Prospects website also provides Excel files and recommends CSV bulk downloads for database or statistical work. For a larger ranking, use city-level data rather than country urban-population totals.
Keep one row per city and reference date. A useful output schema is:
| Column | Purpose |
|---|---|
city_name |
Reader-facing name |
source_city_name |
Original label, such as Ciudad de México (Mexico City) |
country_or_area |
Scope checks and country filtering |
population |
Numeric value in people |
reference_date |
Date the population describes |
geography_definition |
Degree of Urbanization, city proper or another documented definition |
source_release |
Dataset edition, such as WUP 2025 |
source_url |
Traceable source |
Before exporting:
- Normalize units. Multiply values reported in thousands by 1,000, without implying additional precision.
- Preserve identifiers. Retain source city and country codes where supplied; do not join tables on city name alone.
- Check the scope. Include all three North American subregions before sorting population descending.
- Separate dates and status. Keep future projections distinct from the 2025 estimates.
- Use plain numeric cells. Store
17734000, not the text17.7 million; format the display separately.
For trends, use years from the same release. The UN says its 2025 revision introduces harmonized geospatial methods and supersedes previous city estimates. A difference between releases should not be presented as population growth without checking the methodology. Source: WUP 2025 preface.
Publish the definition alongside the numbers
For this four-row extract, use a caption such as:
North America’s four largest cities by population, 1 July 2025. UN WUP 2025 Degree of Urbanization definition; source estimates reported in thousands and converted to people. Coverage includes Northern America, Central America and the Caribbean. Not municipal or metropolitan-area populations.
Keep that explanation next to the public table, not only in the original workbook. For a longer ranking, also document the cutoff, ties and missing values using the public ranking disclosure checklist.
Once reviewed, upload the clean CSV or spreadsheet to TablePage. Its current publishing flow accepts CSV, TSV, XLSX and XLS, generates a public dataset page and provides a filterable table that readers can explore without signing up. Upload only the intended public extract—not a workbook containing private notes or unrelated sheets. Check that population values remain numeric and that the source and boundary definition are visible before sharing the link.