
U.S. Population Density: 93.8 in 2020, About 96.7 Using 2025 Estimates
Compare official 2020 U.S. population density with a calculation using 2025 estimates, then prepare a sourced CSV for a public data page.

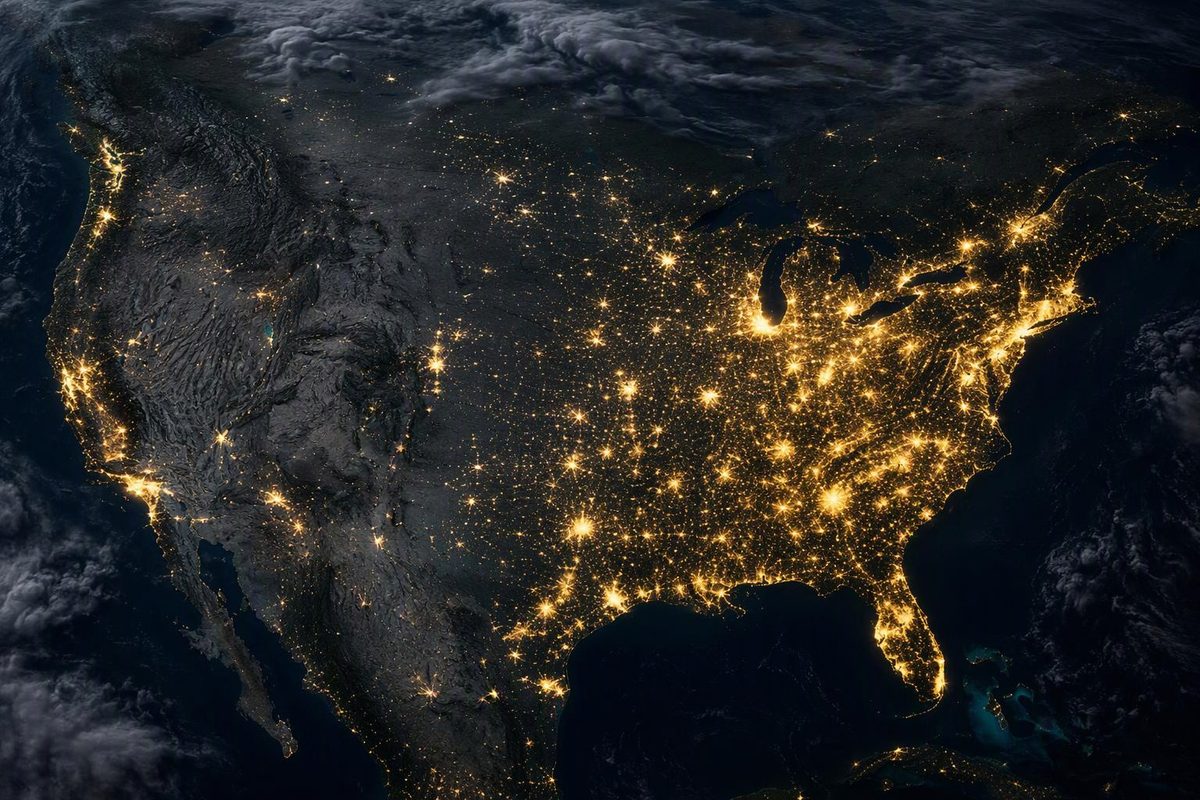
The United States had 93.8 people per square mile of land in the 2020 Census. Using the July 1, 2025 population estimate and the same 2020 land area gives a calculated density of about 96.7 people per square mile, or 37.4 per square kilometer. As of October 10, 2026, the Census Bureau’s U.S. QuickFacts table supplies both population figures and the land area, but its published density row is still labeled 2020.
If you are preparing a spreadsheet or public data page, keep that distinction visible: 93.8 is the published 2020 figure; 96.7 is a calculation using a newer population estimate.
The figures to put in your table
| Population reference date | Population | People per square mile of land | People per square kilometer of land | Measure |
|---|---|---|---|---|
| April 1, 2020 | 331,449,281 | 93.8 | 36.2 | Census population; published density in square miles |
| July 1, 2025 | 341,784,857 | 96.7 | 37.4 | Calculated from the V2025 population estimate |
Both rows use 3,533,038.28 square miles of land, the 2020 land area reported in Census QuickFacts. Square-kilometer densities above are calculated from the population and land-area inputs and rounded to one decimal place.
Here, “United States” means the 50 states and the District of Columbia, including Alaska and Hawaii—not just the contiguous states. The Census Bureau’s resident-population definition excludes Puerto Rico and the other U.S. island areas, as well as people whose usual residence is overseas.
Calculate density with land area, not total area
Population density is:
Population ÷ land area = people per unit of land area
The Census Bureau defines population density using land area, not land plus water. Substituting a total-area figure changes the denominator and produces a different measure.
For the 2025 calculation:
341,784,857 ÷ 3,533,038.28 ≈ 96.7 people per square mile
To convert density per square mile to density per square kilometer, divide by approximately 2.589988. The Census Bureau’s area documentation provides the corresponding square-meter conversion.
Keep full precision in the spreadsheet calculation and round only for display. Converting an already rounded density can introduce avoidable rounding differences.
Prepare a reusable CSV
This starter dataset contains the sourced inputs and rounded density outputs. The 2025 row is explicitly marked as calculated rather than presented as an official QuickFacts density value.
geography,population_date,population,land_area_year,land_area_sq_mi,density_per_sq_mi,measure_type
United States,2020-04-01,331449281,2020,3533038.28,93.8,published_2020_density
United States,2025-07-01,341784857,2020,3533038.28,96.7,calculated_v2025_density
To add density per square kilometer in column H, use =C2/E2/2.589988, fill down, and format the results to one decimal place. This calculates from the population and land-area inputs rather than the rounded values in column F, and leaves the published 2020 value intact.
Before publication:
- Keep numeric fields numeric. Store
341784857, not341,784,857 people; put units in headers or accompanying notes. - Preserve both dates. The population reference date and land-area year describe different inputs.
- Document provenance. Include the Census source, the population-estimate vintage
V2025, the retrieval date and the calculation method alongside the table. - Label the result accurately. Use “Calculated density using July 2025 population and 2020 land area,” not “2025 Census density.”
Publish a table readers can interpret
TablePage accepts CSV, TSV, XLSX and XLS files and turns an uploaded dataset into a public, shareable page with a filterable table. Upload only the reviewed public-data file, not a workbook containing private notes or sensitive information.
Use a page title such as “United States Population Density: 2020 Census and 2025 Calculation.” Keep the dates, units and measure type visible so readers can distinguish the two rows without opening the original spreadsheet.
For a state-level extension, use the same population vintage and area basis across every row, and keep the national benchmark separate from the state ranking. National density is total population divided by total land area, not a simple average of state densities. It also does not describe the density of a typical neighborhood. Add county or city rows when local settlement patterns are the reader’s actual question, and include the disclosures a public ranking table needs if you rank those places.