
The US Is About Three Times India’s Area—Including Alaska and Hawaii
Compare US and India total area, check the contiguous-US difference, and prepare a sourced CSV for a clear public comparison table.

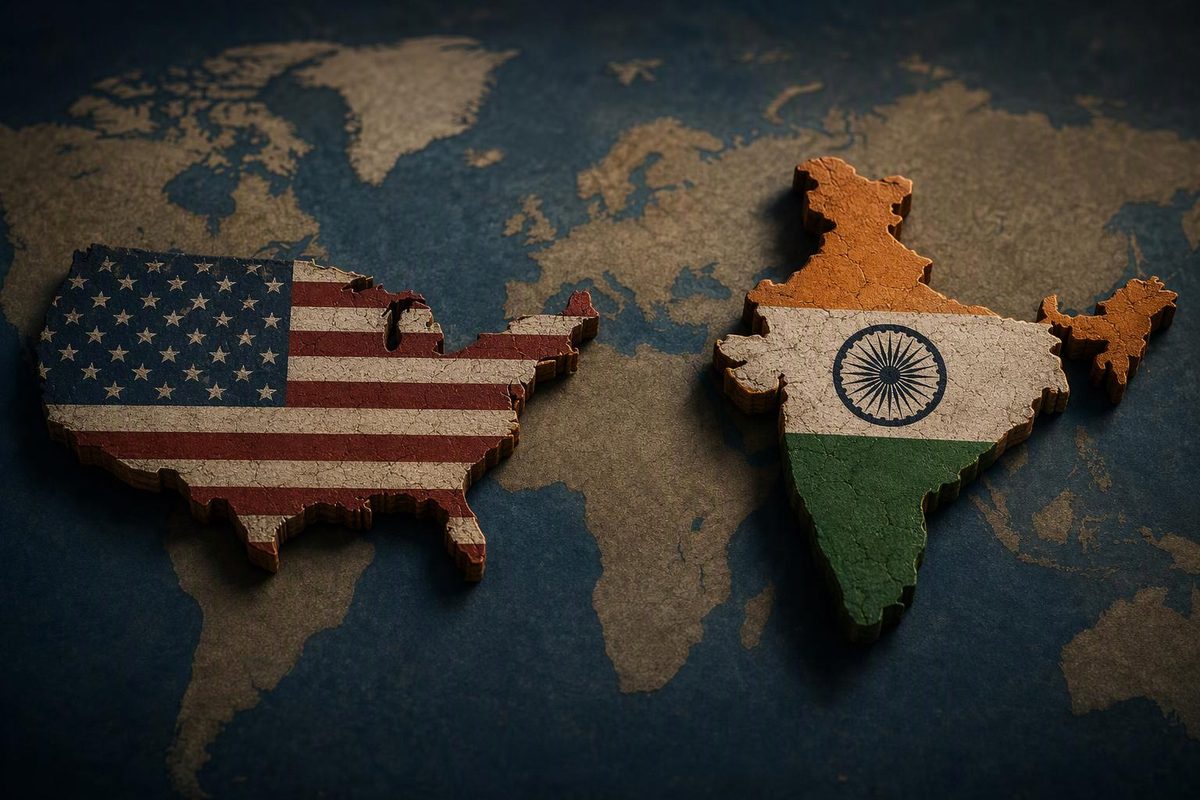
The United States is about 2.99 times the size of India by total area: 9,833,517 km² versus 3,287,263 km². India is therefore about 33.4% of the US’s area. This comparison uses the US Census Bureau’s figure for all 50 states and Washington, DC, and the area reported by India’s National Portal. (US Census area table, India at a Glance)
For a spreadsheet or public data page, the important choice is what “US” includes. Excluding Alaska and Hawaii changes the ratio substantially.
The comparison table
| Geography | Total area (km²) | Total area (square miles) | Scope and basis |
|---|---|---|---|
| United States | 9,833,517 | 3,796,742 | 50 states and Washington, DC; Census 2010 area measurements |
| India | 3,287,263 | 1,269,219 | National Portal’s reported country area; square miles calculated |
| Contiguous United States | 8,081,867 | 3,120,426 | 48 states and Washington, DC; calculated by subtracting Alaska and Hawaii |
Sources and calculation notes: The Census table supplies the US, Alaska and Hawaii figures. Its boundaries are dated January 1, 2010, with land and water feature updates through August 2010. The contiguous-US calculation uses its published whole-number values: 9,833,517 − 1,723,337 − 28,313 = 8,081,867 km². The square-mile calculation subtracts the corresponding published values separately.
The Indian National Portal reports 3,287,263 km². India’s square-mile value is calculated using the Census table’s conversion factor, 1 square mile = 2.58998811 km², and rounded to the nearest whole square mile. Sources checked October 8, 2026; that is a retrieval date, not a new measurement year.
Using these figures:
- All 50 states plus DC: the US is 2.99 times India’s area.
- Contiguous US plus DC: the US is 2.46 times India’s area; India is about 40.7% as large.
- Area difference, full US minus India: 6,546,254 km².
“About three times as large” is clearer than “three times larger.” The latter can be read as the original area plus three additional copies. In percentage terms, the full US is approximately 199% larger than India.
Keep the definitions visible
This is a total-area comparison, not a land-only comparison. The Census total includes land and water, with separate categories for inland, coastal, Great Lakes and territorial water. Its US row excludes Puerto Rico and the Island Areas. (Census definitions and footnotes)
The Indian profile gives a country-area figure without an equivalent water-category breakdown. These are official reported totals, not a newly harmonized geographic dataset. Retain the sources’ geographic coverage and boundary conventions in your notes; do not silently replace one country’s total area with its land area.
“Size” here means geographic area. Population, economic output and population density need separate columns, definitions and reference dates.
Prepare the spreadsheet
Copy this sample CSV into a plain-text file. It reproduces the comparison above; numeric fields have no thousands separators so they remain straightforward to parse.
geography,total_area_km2,total_area_sq_mi,basis
United States,9833517,3796742,Census 2010: 50 states plus DC
India,3287263,1269219,National Portal area; square miles calculated
Contiguous United States,8081867,3120426,Calculated: US minus Alaska and Hawaii
With those headers in row 1, the US in row 2 and India in row 3, calculate:
| Output | Spreadsheet formula | Rounded result |
|---|---|---|
| US-to-India area ratio | =B2/B3 |
2.99 |
| India as a share of US area | =B3/B2 |
33.4% |
| US percentage larger than India | =(B2-B3)/B3 |
199.1% |
Format the last two results as percentages. Keep the published whole-number areas and round only the displayed results. For a reusable dataset, add source_url, retrieved_date and calculation_note columns, preserving the distinction between reported and calculated values.
Publish a comparison readers can check
TablePage accepts CSV, TSV, XLSX and XLS uploads and generates a public dataset page with a shareable link and filterable table. Upload the prepared file, then check that the area columns are interpreted as numbers and that the scope and source notes remain readable. Publish only information intended to be public.
For a visual, use two bars—United States and India—with a zero baseline and an axis labeled Total area (km²). Keep the contiguous-US figure in the table or show it as a separate alternative comparison: it overlaps with the full-US geography and should not be presented as an additional country. A table paired with a chart lets readers see the approximate three-to-one relationship without losing the exact figures or definitions.